You’re ready to invest in paper stick making machine configurations. The price difference between entry-level and industrial-grade equipment can be substantial—sometimes 3x to 5x higher for industrial systems. It’s tempting to save money upfront.
But here’s the question that experienced production managers always ask: What will this machine cost me over five years?
This guide breaks down the total cost of ownership (TCO) for entry-level versus industrial paper stick equipment. You’ll learn where each category excels, where it falls short, and how to match equipment class to your production volume, quality requirements, and business horizon.
What Is Total Cost of Ownership (TCO) for Paper Stick Machinery?
Total cost of ownership goes far beyond the purchase price. For paper stick production equipment, TCO typically includes five cost categories over a 3-to-7-year ownership period:
| Cost Category | Typical Percentage of TCO | Description |
|---|---|---|
| Initial purchase price | 25–40% | Machine cost, delivery, installation, and initial tooling |
| Consumables | 30–45% | Adhesive, paper waste, lubricants, replacement blades |
| Maintenance and repairs | 10–20% | Spare parts, technician labor, and scheduled servicing |
| Energy consumption | 5–12% | Electricity for motors, controls, and auxiliary systems |
| Downtime and lost production | 5–15% | Unplanned stoppages, changeover time, and quality rejects |
According to a 2023 cost analysis published by the Association for Manufacturing Technology (AMT) , manufacturers who evaluate equipment based solely on purchase price pay an average of 34% more over five years compared to those who use TCO-based selection criteria.
What this means for you: A machine that costs 50% less upfront but consumes twice the adhesive and breaks down monthly may be the most expensive choice over time.
Defining Entry-Level vs. Industrial Paper Stick Equipment
Before comparing costs, it’s important to understand what distinguishes these two equipment categories.
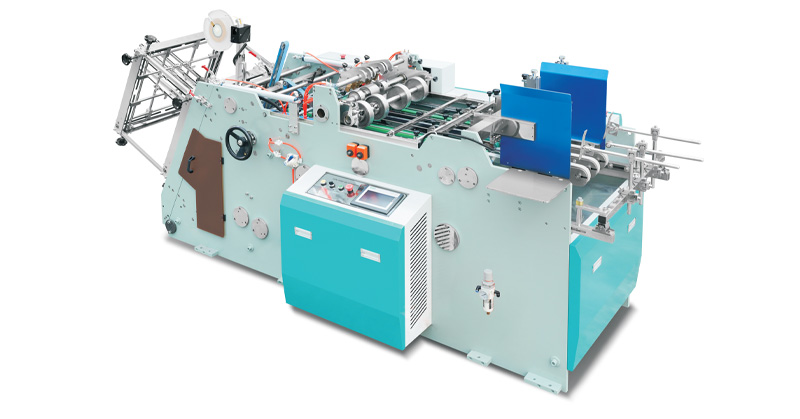
Entry-Level Paper Stick Machines
Entry-level machines are typically designed for small-scale production, startups, or businesses diversifying into paper sticks for the first time.
Typical characteristics:
-
Mechanical drive systems (cam or gear-based)
-
Lower initial investment ($15,000–35,000 range typical)
-
Simpler controls; limited programmability
-
Single stick diameter capability without manual changeover
-
Production speeds: 200–500 pieces per minute
-
Basic safety guarding; limited certifications
Best suited for:
-
Production volumes under 2 million sticks per month
-
One or two stick diameter requirements
-
Markets with ±0.2 mm tolerance acceptance
-
Operations with in-house mechanical maintenance capability
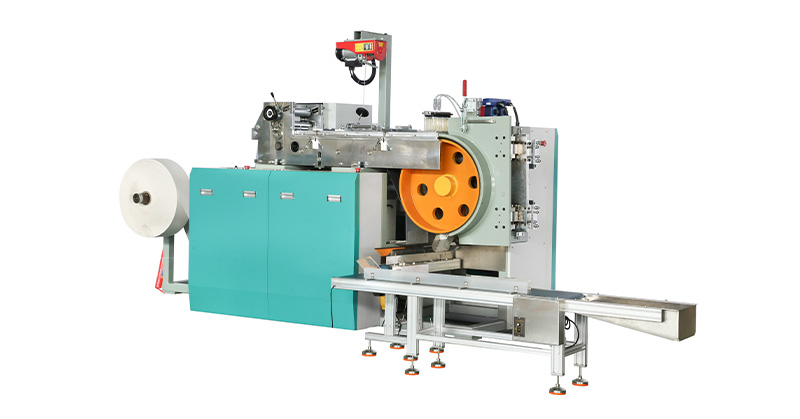
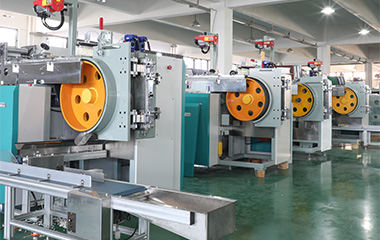
Industrial-Grade Paper Stick Machines
Industrial equipment is engineered for continuous operation, high volume, and demanding quality specifications.
Typical characteristics:
-
Servo drive systems with electronic synchronization
-
Higher initial investment ($50,000–120,000+ range)
-
Touchscreen HMI with programmable parameters
-
Multi-diameter capability; rapid changeover (<15 minutes)
-
Production speeds: 600–1,000+ pieces per minute
-
Full safety compliance (CE, UL, etc.)
-
Certifications for food-contact and medical applications
Best suited for:
-
Production volumes above 5 million sticks per month
-
Multiple diameter and length specifications
-
Medical or food-grade tolerance requirements (±0.1 mm or tighter)
-
Operations with limited mechanical maintenance staff
Five-Year TCO Comparison: Entry-Level vs. Industrial
The following analysis assumes a 5-year ownership period, two shifts per day (16 hours), 250 operating days per year, and a production target of 8 million sticks per month at 3.0 mm diameter.
Category 1: Initial Purchase and Installation
| Cost Element | Entry-Level | Industrial | Difference |
|---|---|---|---|
| Machine base price | $25,000 | $85,000 | +$60,000 |
| Delivery and customs | $3,000 | $4,000 | +$1,000 |
| Installation and training | $2,000 | $5,000 | +$3,000 |
| Initial tooling (molds/mandrels) | $1,500 | $3,500 | +$2,000 |
| Total upfront | $31,500 | $97,500 | +$66,000 |
Winner: Entry-level (lower barrier to entry)
Category 2: Consumables (5-Year Total)
Consumables represent the largest TCO category and often reveal the true cost difference between equipment classes.
| Consumable Element | Entry-Level | Industrial | Reason for Difference |
|---|---|---|---|
| Adhesive consumption per 1,000 sticks | 0.025–0.035 g | 0.008–0.015 g | Servo-controlled applicators use 40–60% less adhesive |
| Paper waste percentage | 8–12% | 3–5% | Precision cutting and tension control reduce waste |
| Blade replacement frequency | Every 200–300 hours | Every 800–1,000 hours | Industrial-grade steel and precision grinding |
| Lubricants and filters | $800/year | $400/year | Sealed bearings reduce lubrication needs |
5-year consumables calculation (8 million sticks/month):
| Item | Entry-Level | Industrial |
|---|---|---|
| Adhesive cost (5 years) | $28,000 | $12,000 |
| Paper waste cost (5 years) | $42,000 | $18,000 |
| Blade replacements (5 years) | $6,500 | $2,200 |
| Lubricants and supplies (5 years) | $4,000 | $2,000 |
| Total consumables (5 years) | $80,500 | $34,200 |
Winner: Industrial (saves approximately $46,300 over 5 years on consumables alone)
Data from the paper stick machine application case study demonstrates how industrial-grade equipment achieved a 52% reduction in adhesive consumption for a daily chemical manufacturer.
Category 3: Maintenance and Repairs (5-Year Total)
| Maintenance Element | Entry-Level | Industrial | Reason for Difference |
|---|---|---|---|
| Scheduled maintenance frequency | Monthly | Quarterly | Industrial components have longer service intervals |
| Spare parts cost (annual average) | $2,500 | $1,800 | Entry-level parts fail more often but cost less individually |
| Technician hours (annual average) | 120 hours | 50 hours | More frequent breakdowns and adjustments |
| Major repair events (5 years) | 2–3 events | 0–1 events | Industrial-grade build quality and component selection |
5-year maintenance calculation:
| Item | Entry-Level | Industrial |
|---|---|---|
| Spare parts (5 years) | $12,500 | $9,000 |
| Technician labor (5 years @ $35/hr) | $21,000 | $8,750 |
| Major repairs (average) | $5,000 | $2,000 |
| Total maintenance (5 years) | $38,500 | $19,750 |
Winner: Industrial (saves approximately $18,750 over 5 years)
Category 4: Energy Consumption (5-Year Total)
| Energy Element | Entry-Level | Industrial |
|---|---|---|
| Average power draw (operating) | 4.5 kW | 3.2 kW |
| Energy cost per operating hour ($0.12/kWh) | $0.54 | $0.38 |
| Operating hours (5 years: 2 shifts, 250 days/year) | 20,000 hours | 20,000 hours |
| Total energy cost (5 years) | $10,800 | $7,600 |
Winner: Industrial (saves approximately $3,200 over 5 years)
According to efficiency benchmarks from the U.S. Department of Energy’s Advanced Manufacturing Office, servo-driven industrial equipment typically consumes 25–35% less electricity than equivalent mechanical systems, primarily due to regenerative drives and motors that draw power only during active motion.
Category 5: Downtime and Lost Production (5-Year Total)
This is the most variable and often the most underestimated TCO category. Every hour of unplanned downtime represents lost output and, for contract manufacturers, potentially lost customers.
| Downtime Element | Entry-Level | Industrial | Reason for Difference |
|---|---|---|---|
| Unplanned downtime (hours/year) | 80–120 hours | 15–25 hours | Industrial reliability and predictive diagnostics |
| Changeover time per diameter change | 45–60 minutes | 10–15 minutes | Servo-driven parameter changes vs. mechanical adjustments |
| Changeovers per week (average) | 2 | 2 | Same assumption for comparison |
| Production value per operating hour | $150 | $150 | Same output value assumption |
5-year downtime calculation:
| Item | Entry-Level | Industrial |
|---|---|---|
| Unplanned downtime hours (5 years) | 500 hours | 100 hours |
| Lost production value (unplanned) | $75,000 | $15,000 |
| Changeover time per week (60 min vs 15 min = 45 min diff) | 39 hours/year | — |
| Lost production value (changeover difference over 5 years) | $29,250 | — |
| Total downtime cost (5 years) | $104,250 | $15,000 |
Winner: Industrial (saves approximately $89,250 over 5 years)
Critical insight: Downtime costs often exceed the initial purchase price difference within 2–3 years for high-volume operations. A $66,000 higher upfront investment for industrial equipment can be recovered through downtime savings alone within the first 18 months.
Five-Year TCO Summary Table
| Cost Category | Entry-Level | Industrial | Difference (Industrial Better/Worse) |
|---|---|---|---|
| Initial purchase and installation | $31,500 | $97,500 | -$66,000 (worse) |
| Consumables (5 years) | $80,500 | $34,200 | +$46,300 (better) |
| Maintenance and repairs (5 years) | $38,500 | $19,750 | +$18,750 (better) |
| Energy consumption (5 years) | $10,800 | $7,600 | +$3,200 (better) |
| Downtime and lost production (5 years) | $104,250 | $15,000 | +$89,250 (better) |
| TOTAL COST OF OWNERSHIP (5 YEARS) | $265,550 | $174,050 | +$91,500 (better) |
Key finding: Despite a $66,000 higher upfront investment, industrial-grade paper stick equipment delivers approximately **$91,500 lower total cost of ownership** over five years—representing a 34% reduction in overall cost.
Break-Even Analysis: When Does Industrial Equipment Pay Off?
The break-even point depends on your production volume and operating schedule. Here’s how the math works:
Initial investment gap: $66,000
Annual operating savings (industrial vs. entry-level):
| Savings Category | Annual Savings |
|---|---|
| Consumables | $9,260 |
| Maintenance | $3,750 |
| Energy | $640 |
| Downtime (excluding changeover) | $12,000 |
| Total annual operating savings | $25,650 |
Simple break-even calculation: $66,000 ÷ $25,650 = 2.6 years
After approximately 2.5 years, industrial equipment becomes the more economical choice. Over a 5-year ownership period, every dollar invested in industrial equipment above entry-level pricing returns approximately $1.38 in operating cost savings.
For operations running three shifts (24 hours/day), the break-even point drops to approximately 18 months due to accelerated consumables and downtime savings.
When Entry-Level Equipment Makes Sense
Industrial equipment offers superior TCO for most medium-to-high volume operations, but entry-level machinery remains the right choice in specific scenarios.
Scenario 1: Production Volume Below 1 Million Sticks Per Month
At low volumes, the consumables and downtime savings of industrial equipment cannot overcome the upfront price gap. Entry-level machinery may never reach break-even.
Scenario 2: Startup or Market Validation Phase
If you’re uncertain about long-term demand or plan to produce multiple product types in small batches, starting with entry-level equipment preserves capital for other priorities.
Scenario 3: Backup or Redundancy Line
Some established manufacturers keep entry-level machines as backup capacity for peak seasons or emergency production. In this role, uptime is less critical.
Scenario 4: Very Loose Tolerance Requirements
If your market accepts ±0.2 mm diameter variation and surface imperfections, the precision advantages of industrial equipment provide limited value.
For a practical example of how a startup successfully scaled from entry-level to industrial equipment, review the paper stick machine application case study.
Hidden Costs Often Overlooked in Equipment Comparisons
When evaluating paper stick equipment, buyers frequently miss these cost factors:
1. Operator Training Time
Entry-level machines may seem simpler, but their lack of diagnostic software means operators need more mechanical troubleshooting skills. Industrial touchscreen interfaces reduce training time from weeks to days.
2. Quality Rejection Costs
Industrial equipment’s tighter tolerances (typically ±0.1 mm vs. ±0.2 mm) translate directly into lower rejection rates. At 8 million sticks/month, a 2% rejection difference represents 160,000 unusable sticks monthly.
3. Certification and Market Access
Industrial equipment is more likely to include CE, FDA-compliant adhesive systems, and medical-grade certifications. Without these, you may be unable to access export markets or premium customers.
4. Resale Value
After 5 years, industrial equipment typically retains 30–40% of its original value. Entry-level machinery often retains 10–15% at best.
Decision Framework: Which Equipment Class Fits Your Business?
Use this decision matrix to guide your choice:
| Factor | Choose Entry-Level | Choose Industrial |
|---|---|---|
| Monthly production target | Below 2 million sticks | Above 5 million sticks |
| Operating schedule | 1 shift, intermittent | 2–3 shifts, continuous |
| Tolerance requirement | ±0.2 mm or looser | ±0.1 mm or tighter |
| Target markets | Local/price-sensitive | Medical, food-grade, export |
| Maintenance capability | In-house mechanical team | Limited technical staff |
| Business horizon | Under 2 years | 3+ years |
| Capital availability | Constrained | Flexible |
For detailed technical specifications of different equipment classes—including supported diameter ranges, output speeds, and certification documentation—consult the paper stick machinery product series overview.
From TCO Analysis to Equipment Selection
You’ve now established a complete framework for evaluating the total cost of ownership for entry-level versus industrial paper stick equipment.
The key takeaways:
-
Industrial equipment costs 3–4x more upfront but delivers approximately 34% lower TCO over five years
-
Break-even typically occurs between 18 and 30 months, depending on production volume and operating schedule
-
Downtime is the highest hidden cost, often exceeding the purchase price difference within 2–3 years
-
Entry-level makes sense for low volumes, startups, or backup capacity
-
Industrial is the clear choice for medium-to-high volume production, medical/food-grade applications, and businesses with a 3+ year horizon
Once you’ve determined which equipment class aligns with your production volume, quality requirements, and business timeline, the next logical step is comparing specific models within that class—including supported diameters, output speeds, and available certifications.
For a comprehensive review of industrial-grade paper stick equipment specifications and configuration options, visit the paper stick making machine configurations page.
Related Reading
Continue building your paper stick production expertise with these complementary guides:
-
Servo vs Standard Drive Systems for Paper Stick Making Machines
-
Paper Stick Diameter Selection Guide: Matching Specifications to End-Use Applications
-
Adhesive Systems for Paper Sticks: Water-Based vs Hot Melt for Food-Contact Safety
-
Raw Material Specifications for High-Speed Paper Stick Winding Machines
-
Quality Control Checklist for Medical-Grade Paper Stick Production